Research
Computational neuroscience, neurotechnology, and machine learning for medicine. Newest first.
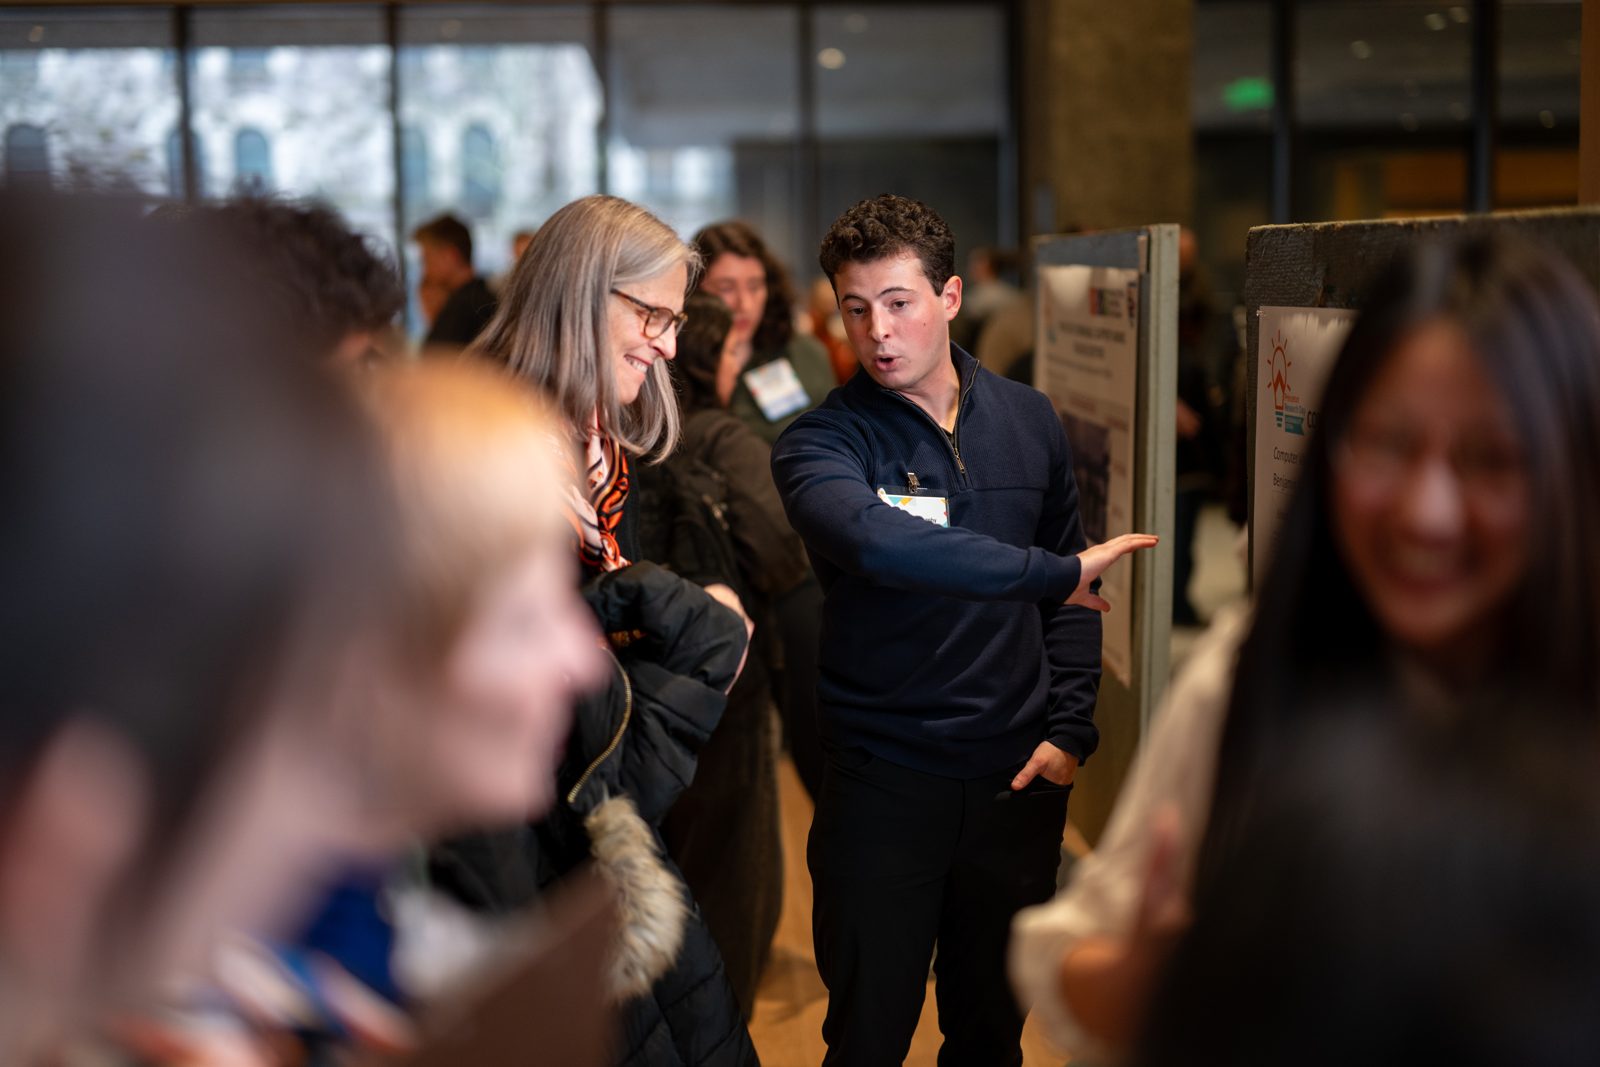
Pesaran Lab, Penn Medicine, with Prof. Bijan Pesaran, Summer 2026
Focused ultrasound for non-invasive deep brain stimulation
Low-intensity focused ultrasound (LIFU) can stimulate deep brain regions without surgery, but the skull distorts and absorbs the beam. I built a planning pipeline, with a small web app on top, that starts from a subject's co-registered CT and MRI and a brain atlas, places and aims a single-element transducer at a target such as the subthalamic nucleus, and runs GPU k-Wave acoustic simulations through the real skull.
A single-element transducer can only emit one waveform, so all the focusing comes from a passive lens. The pipeline designs that lens by acoustic time-reversal: a backward simulation from the target gives the delay each point of the aperture needs, those delays become a freeform 3-D-printable lens, and a forward simulation confirms where the pressure actually peaks. I also checked the skull transmission against published measurements, ran the large simulations on Princeton's Della cluster, designed a tiered plan for the lab's upcoming in-vivo experiments, and wrote the handoff documentation for the next student.
Inputs
Bring your own
- CT + MRI
- Skull and brain masks
- Atlas + labels
- Device STLs
Geometry
CPU only
- Load + register scans
- Find the target
- Entry point + skull normal
- Place the device
- Cut the craniotomy
- Build acoustic maps
- Aim the transducer
- Crop + resample the grid
Two simulations
GPU, k-Wave
- Backward: point source at the target gives the aperture delays
- Build the lens: one resin column per aperture point
- Forward: transducer + lens give the true pressure field
Outputs
Per run
- Pressure chart
- 3-D pressure viewer
- Printable lens (STL)
- Transducer spec
The planning pipeline, from scans to focus. Every run reports the pressure on target, the brain peak and how far it missed, and the global peak with the tissue it lands in, without masking anything to the target. 1. Backward: design
A virtual point source at the target radiates out through the real CT skull. The aperture records when the wave arrives at each point.
Matched filter gives each point's delaythen the lens is printed from those delays2. Forward: confirm
The transducer and the new lens are driven through the same skull, and the simulation measures where the pressure really peaks.
By acoustic reciprocity, what arrives at the aperture in the backward simulation, played in reverse, is what the transducer must emit to refocus on the target. How the passive lens focuses one waveform. A single-element transducer can't steer, so each point of the aperture gets a resin column. Sound travels faster in the resin than in water, so a longer column moves that part of the wave ahead; the lengths are chosen so the curved wavefront corrects for this subject's skull and converges on the target. 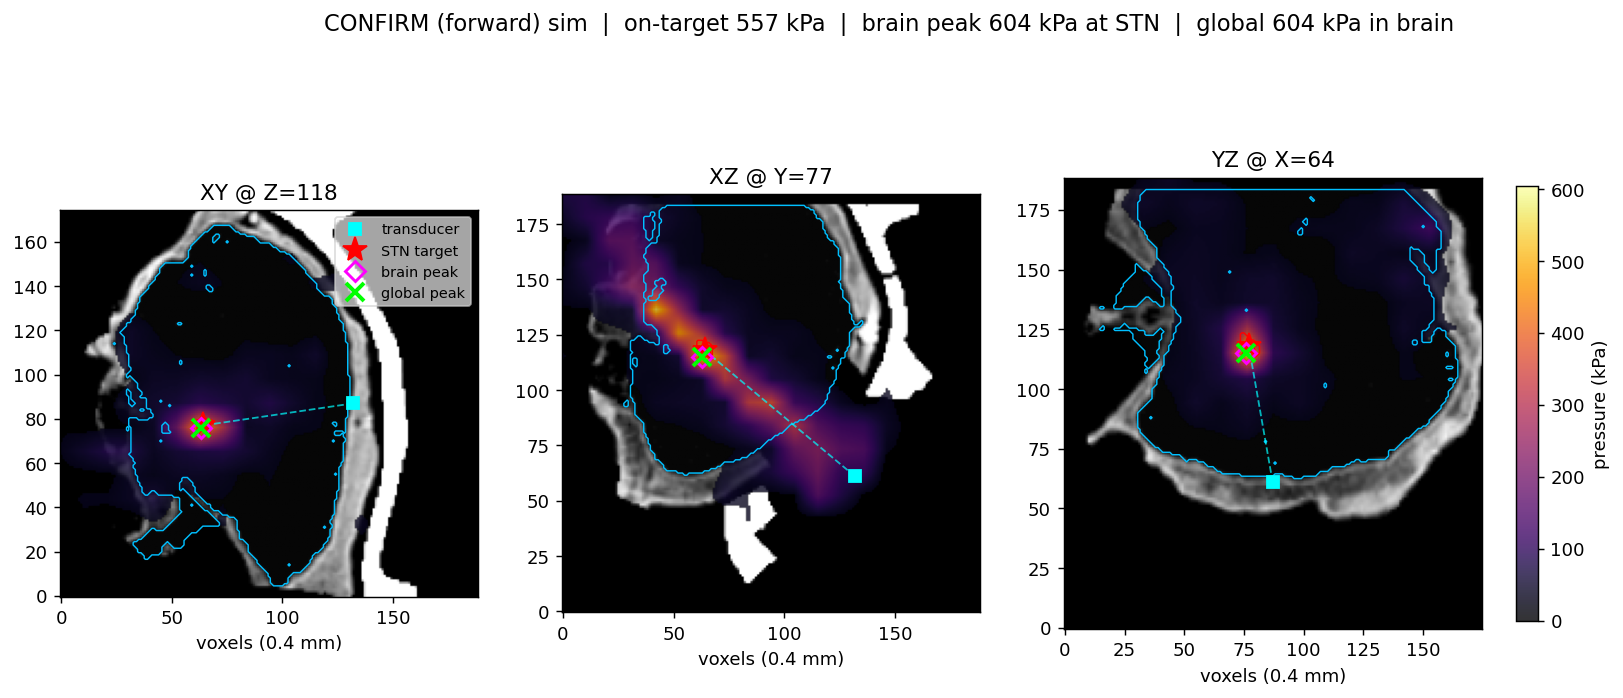
Forward simulation with the designed lens: the pressure peak lands on the subthalamic nucleus (557 kPa on target; brain and global peak 604 kPa at the target). Open full size 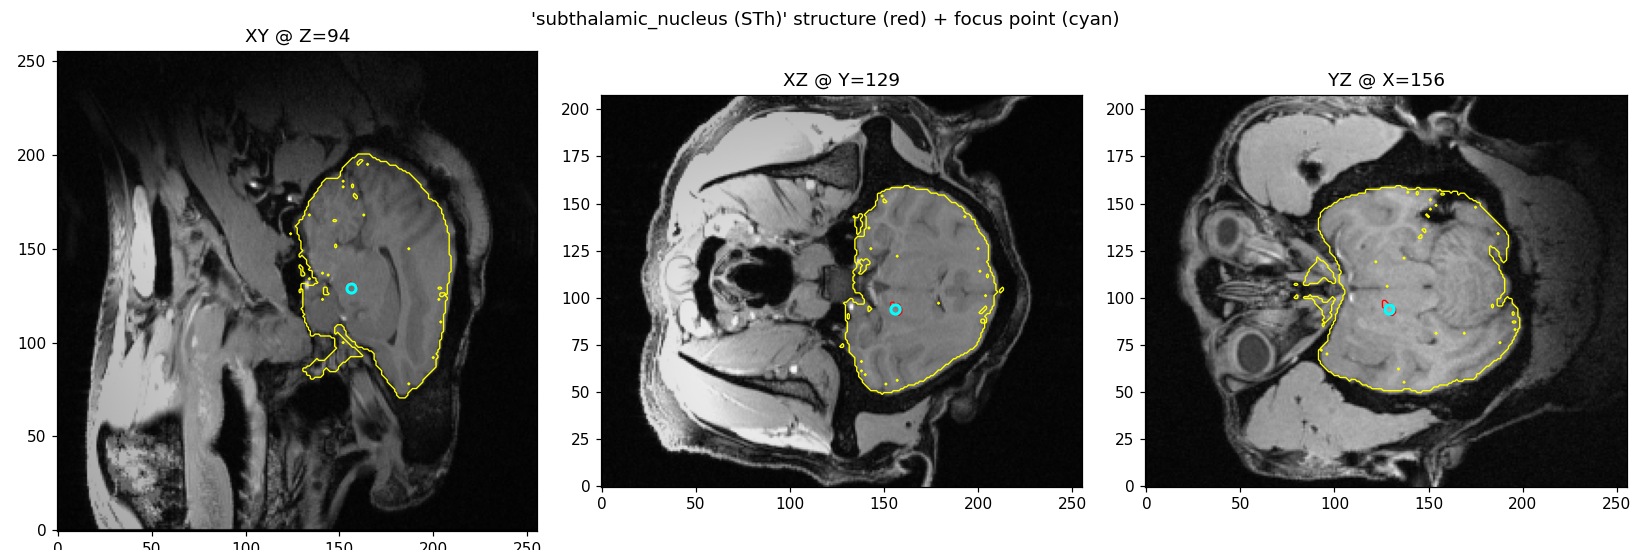
Finding the target: the subthalamic nucleus (red) from the atlas, and the planned focus point (cyan). Open full size 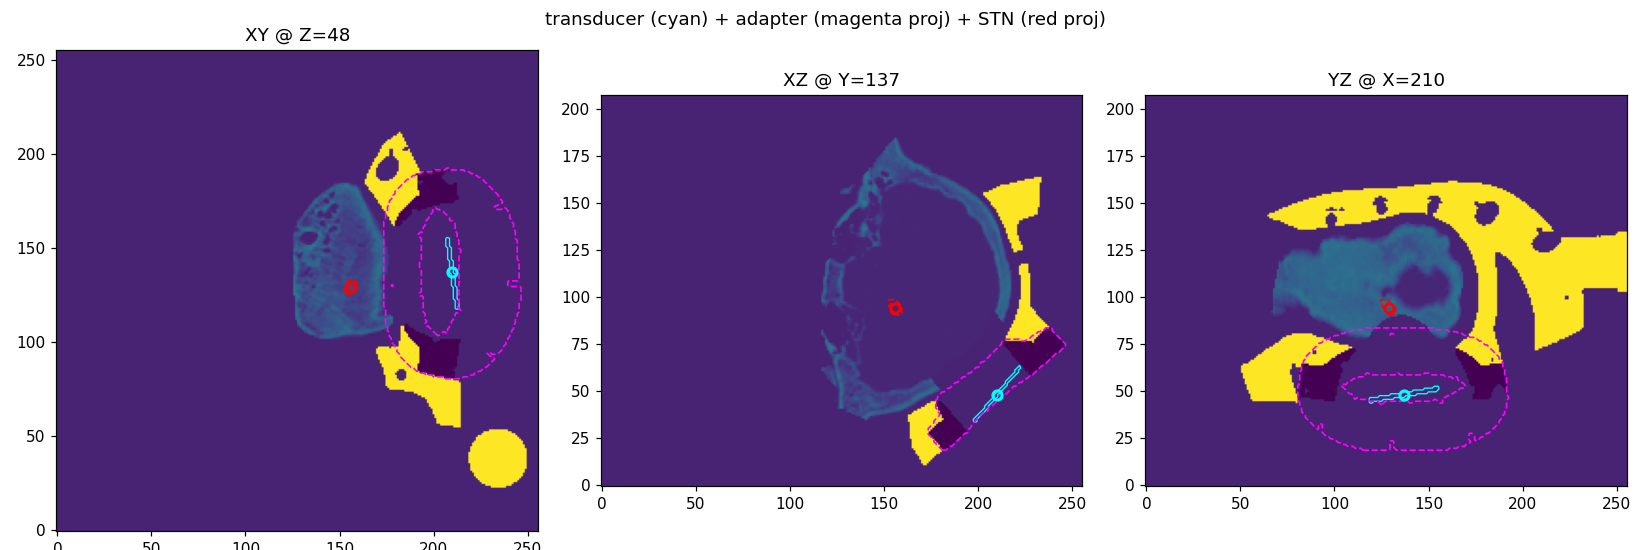
Aiming the transducer (cyan) inside the device adapter (magenta) at the target (red), on the sound-speed map used by the simulation. Open full size Pillow Lab, Princeton Neuroscience Institute, with Prof. Jonathan Pillow, Summer 2026 to present
Deep network models of visual cortex
I'm working on revising Moskovitz et al. (2018) for publication around its central finding: V1 complex cells occupy a higher-dimensional filter subspace than classical receptive-field models assume. I've been recreating the preprint's figures with new analyses, comparing classical estimators (iSTAC, ES-pool, CBF) with fully connected, recurrent, and convolutional networks; sweeping network depth and width; measuring how many dimensions each model's filters really use; and testing whether starting a network from iSTAC filters helps it learn.
I'm also running a project applying model compression to deep network models of motion-sensitive MT/MST neurons, to compare how compressible the dorsal visual pathway is against published results for V1, V4, and IT. That work runs on Princeton's Della computing cluster.
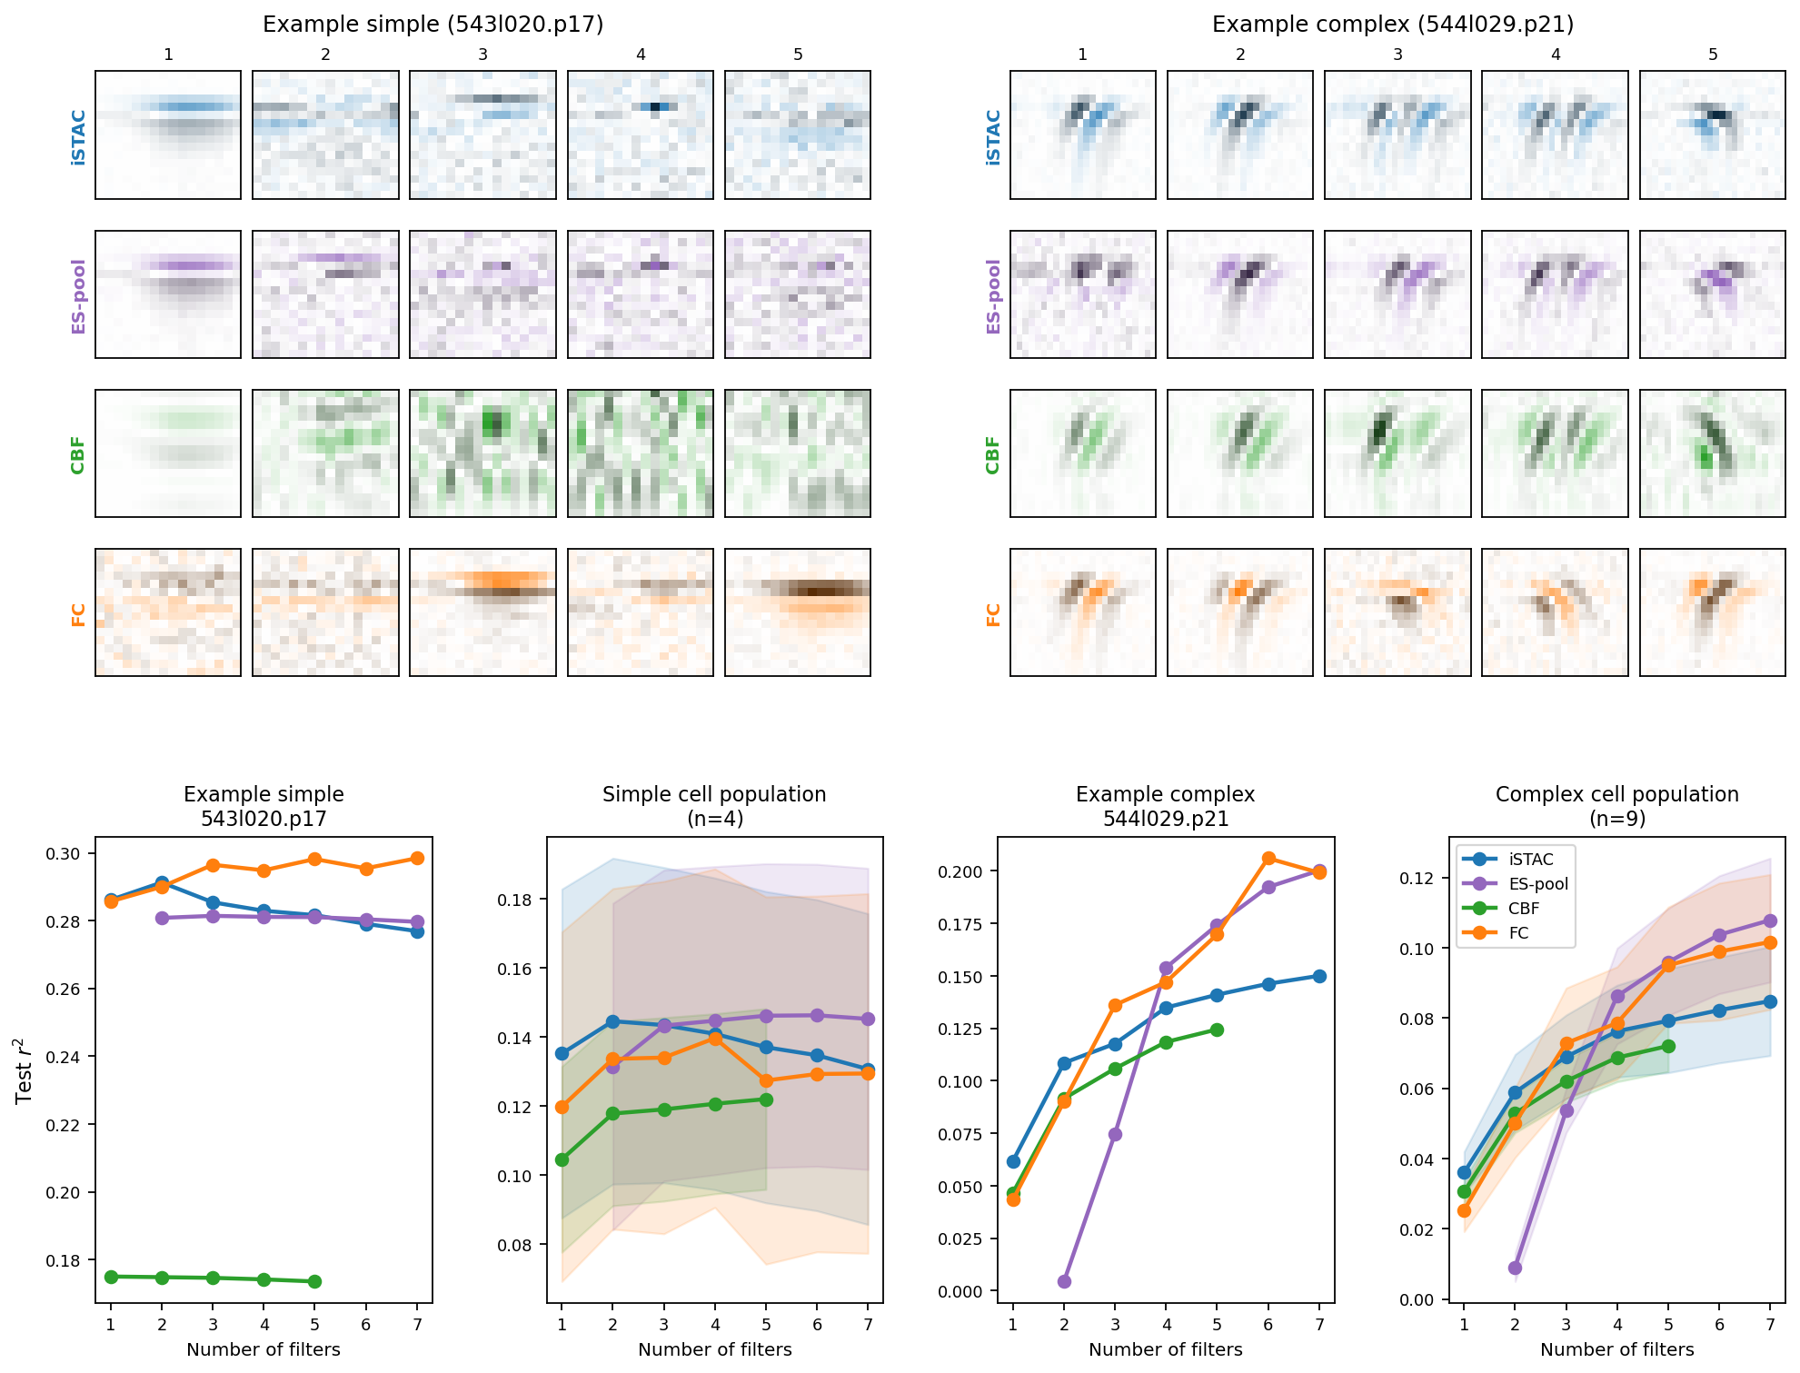
Filters recovered by iSTAC, ES-pool, CBF, and a fully connected network for an example simple and complex cell. Complex cells keep improving as filters are added; simple cells level off. Open full size 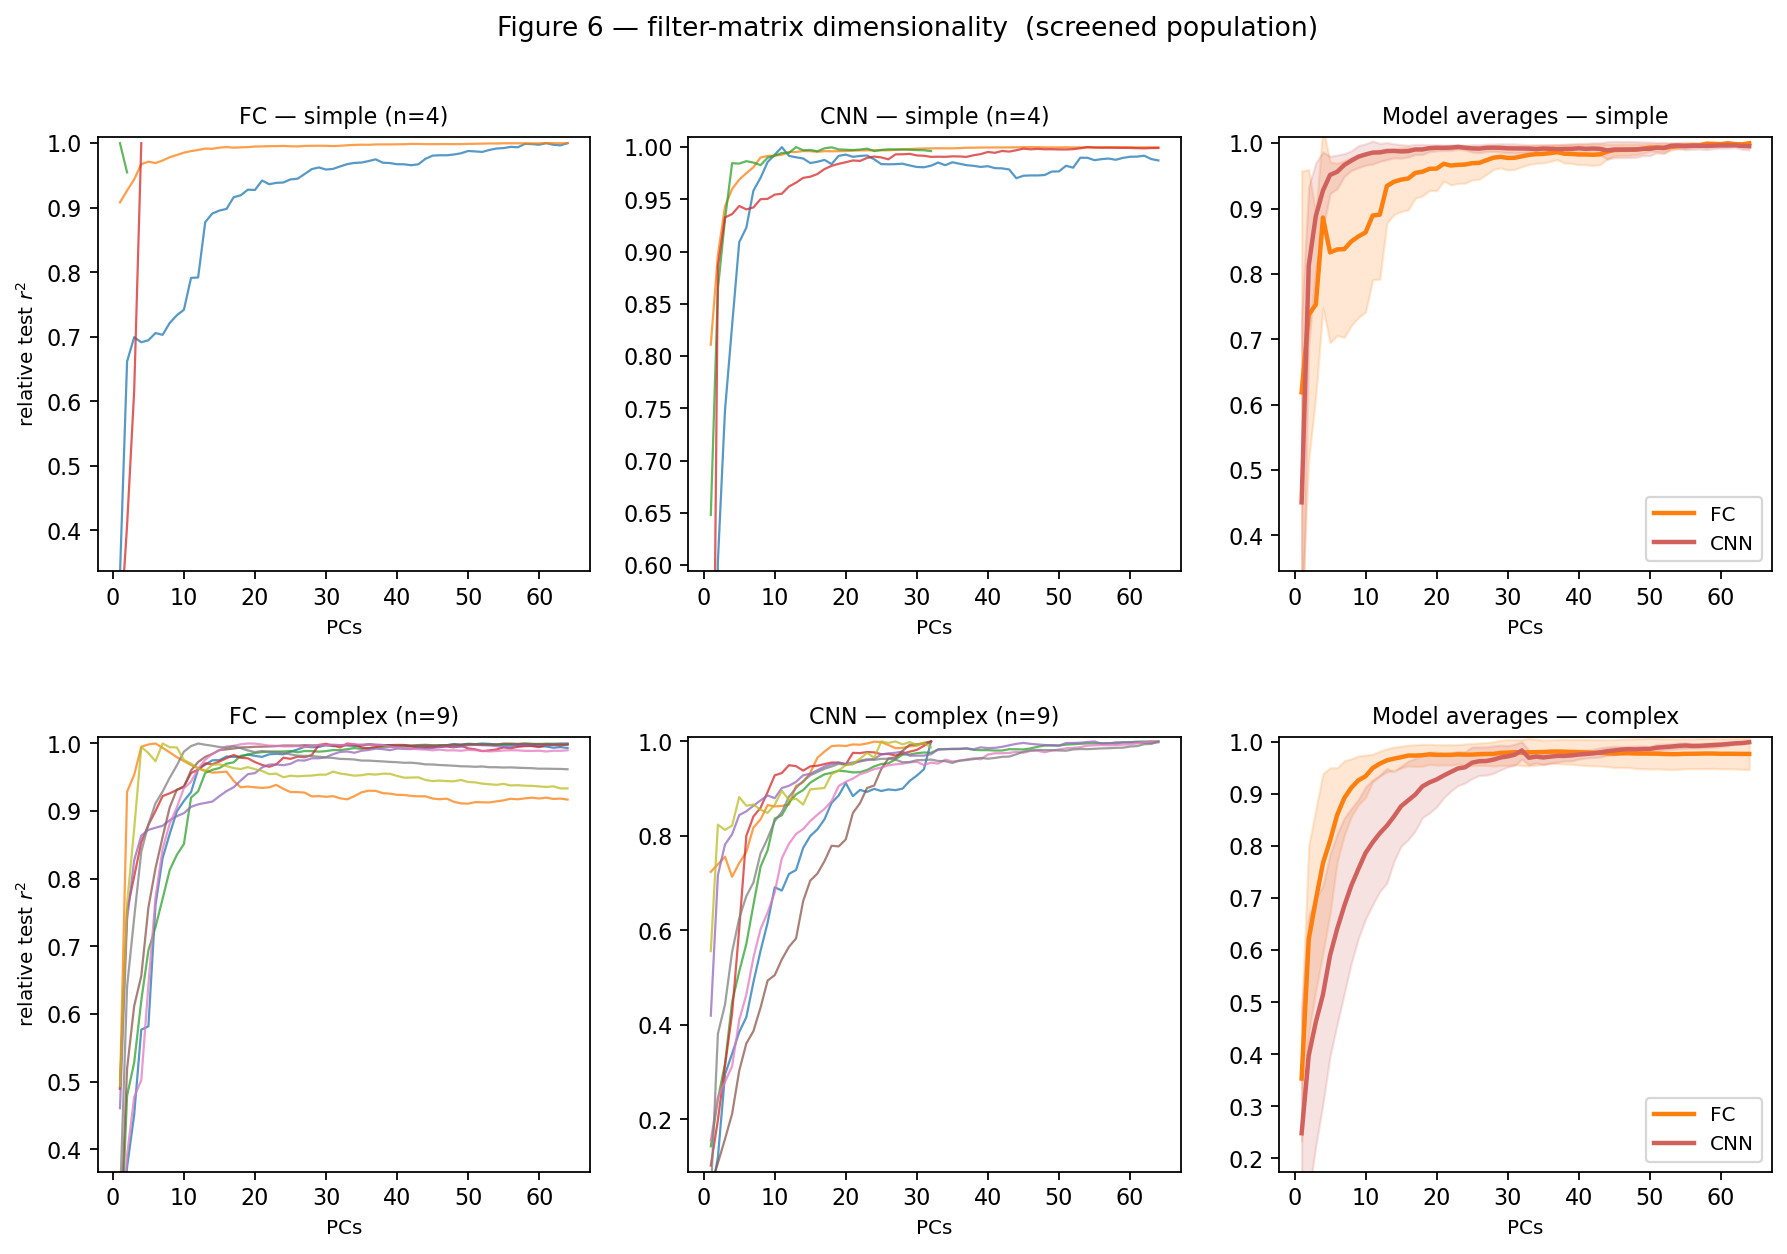
Filter-matrix dimensionality: complex cells need many more dimensions than simple cells before the networks reach full performance. Open full size 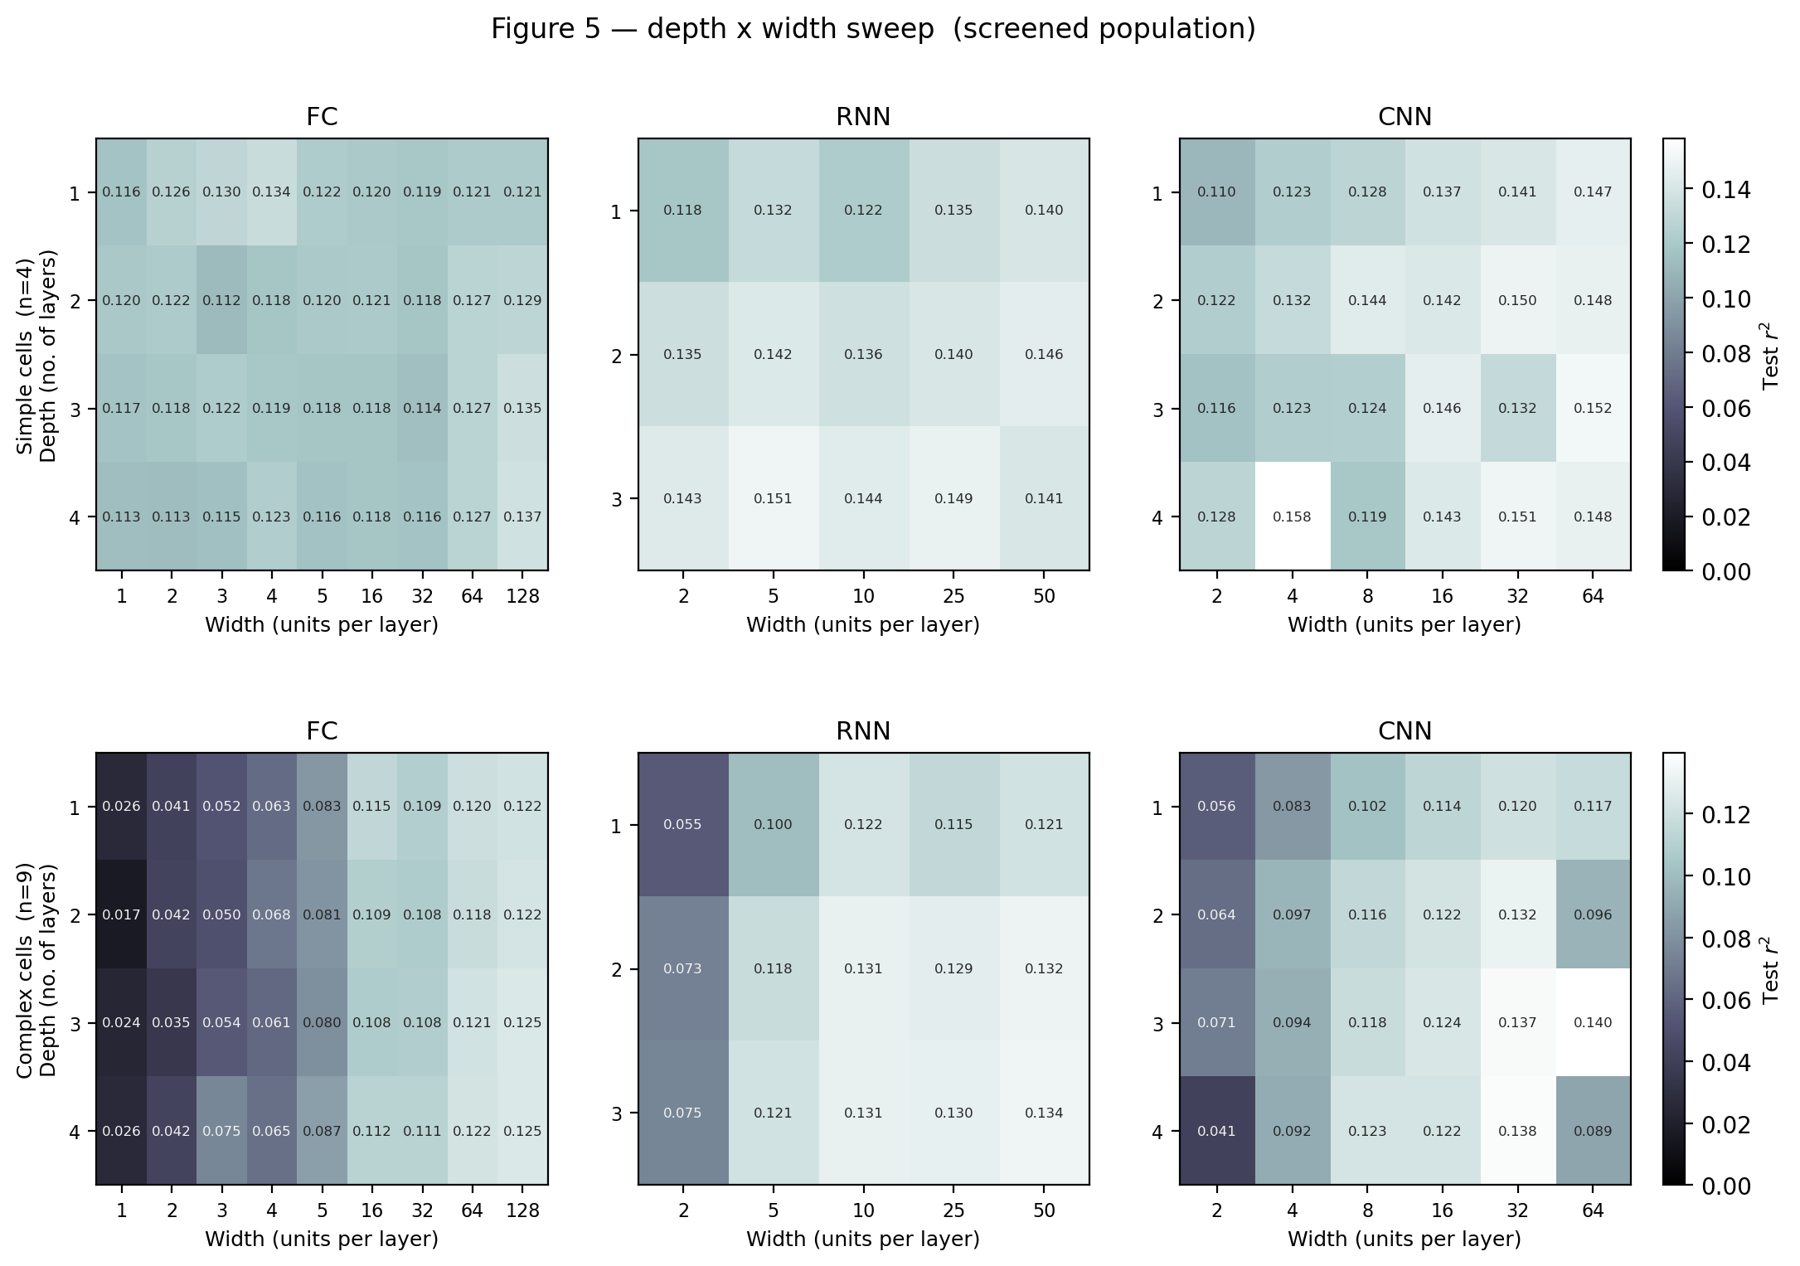
Depth by width sweep: complex cells need wider networks, while simple cells barely change. Open full size 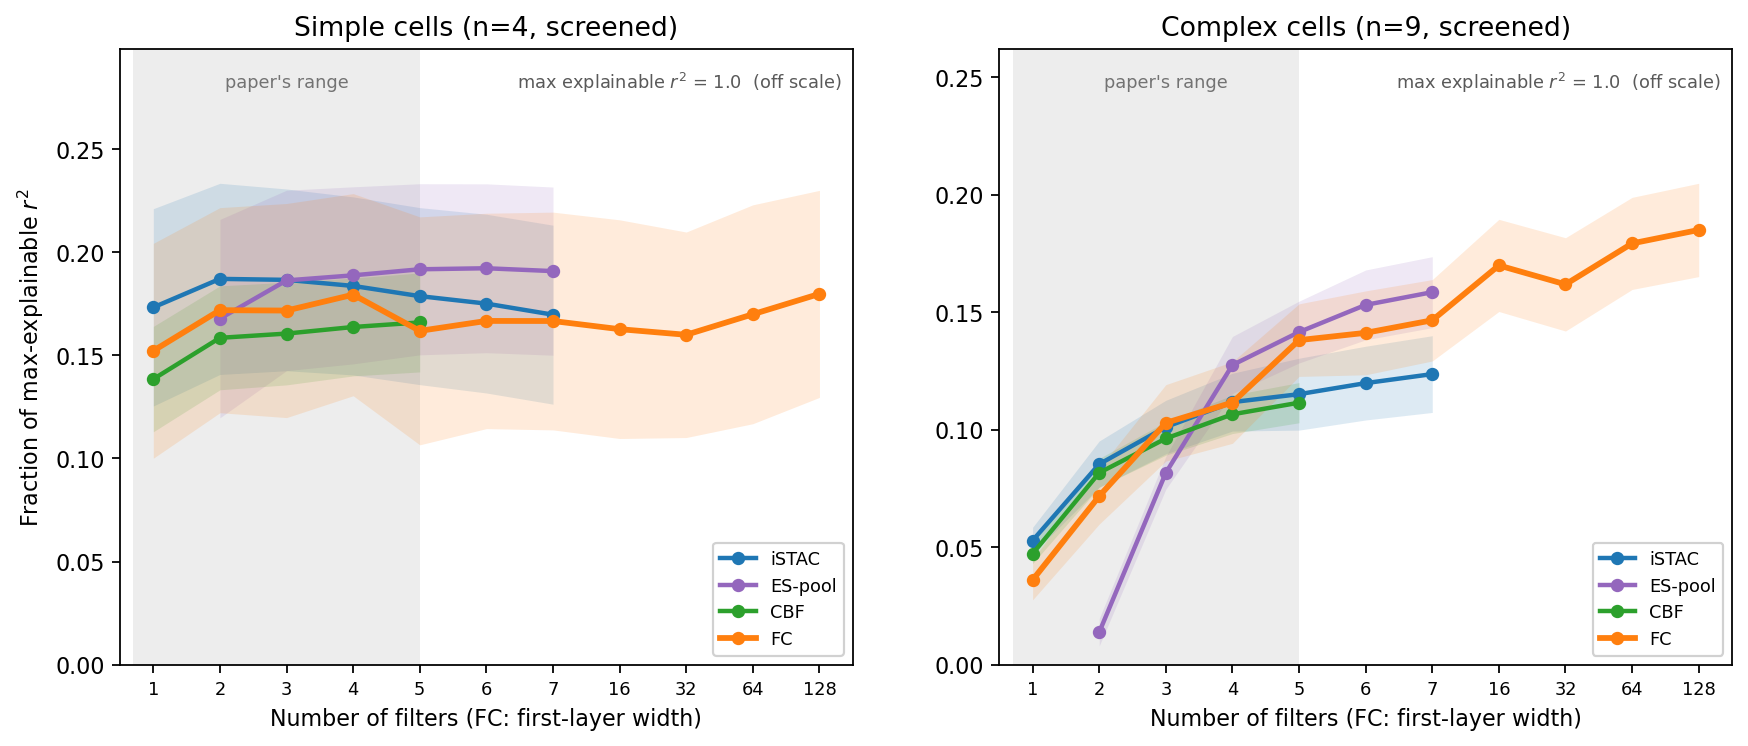
Extending the fully connected model well past the paper's original range: complex cells keep improving up to 128 first-layer units. Open full size 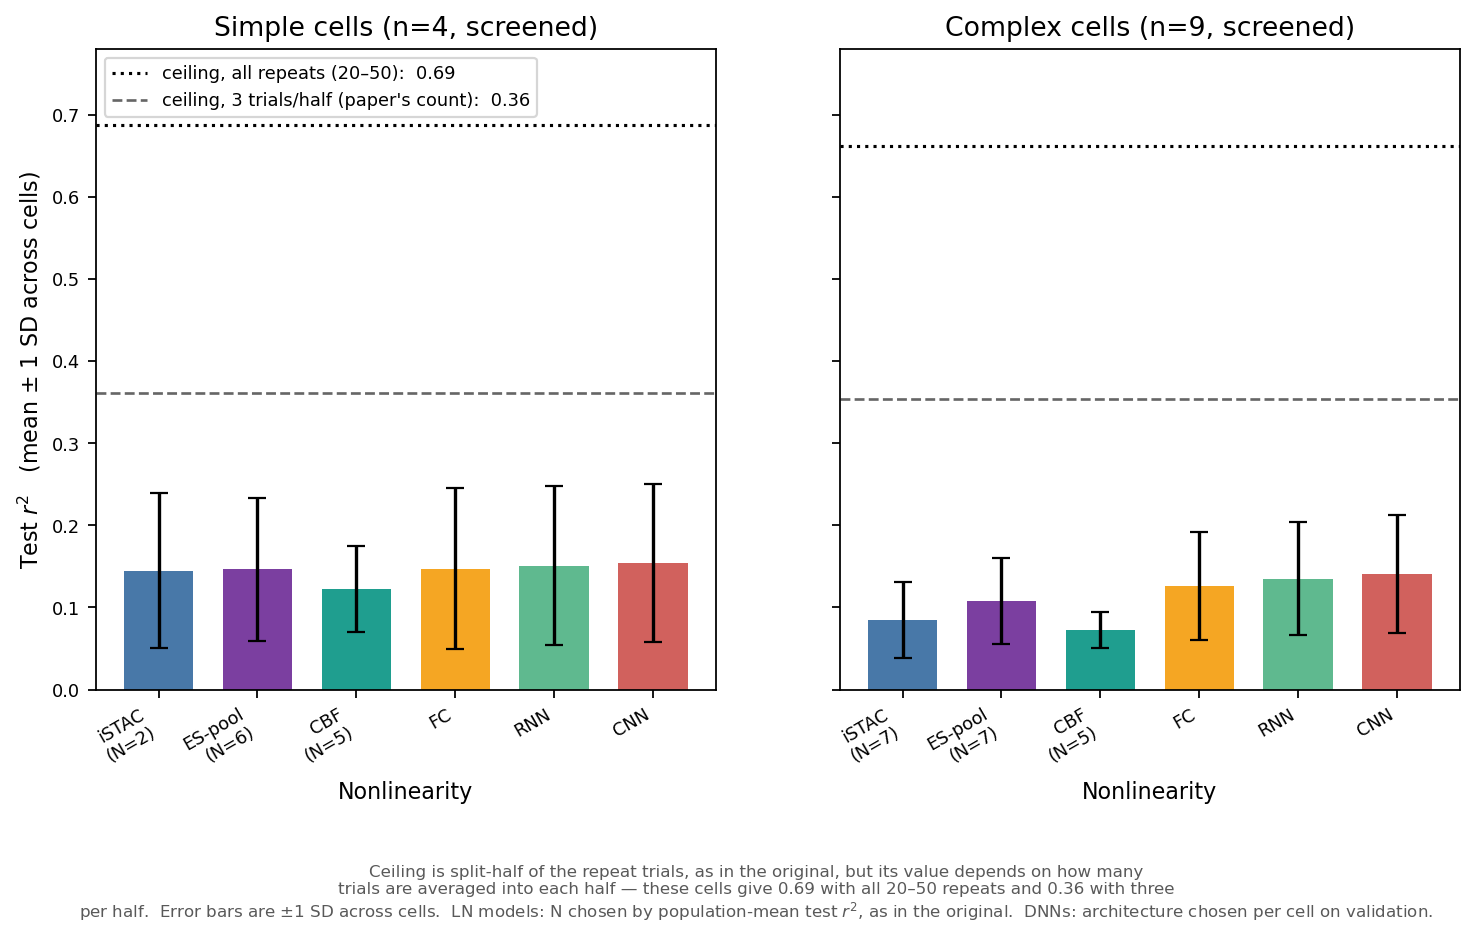
Every model against the split-half noise ceiling. All sit well below what the data could support (0.36 with the paper's trial count, about 0.69 with all repeats). Open full size 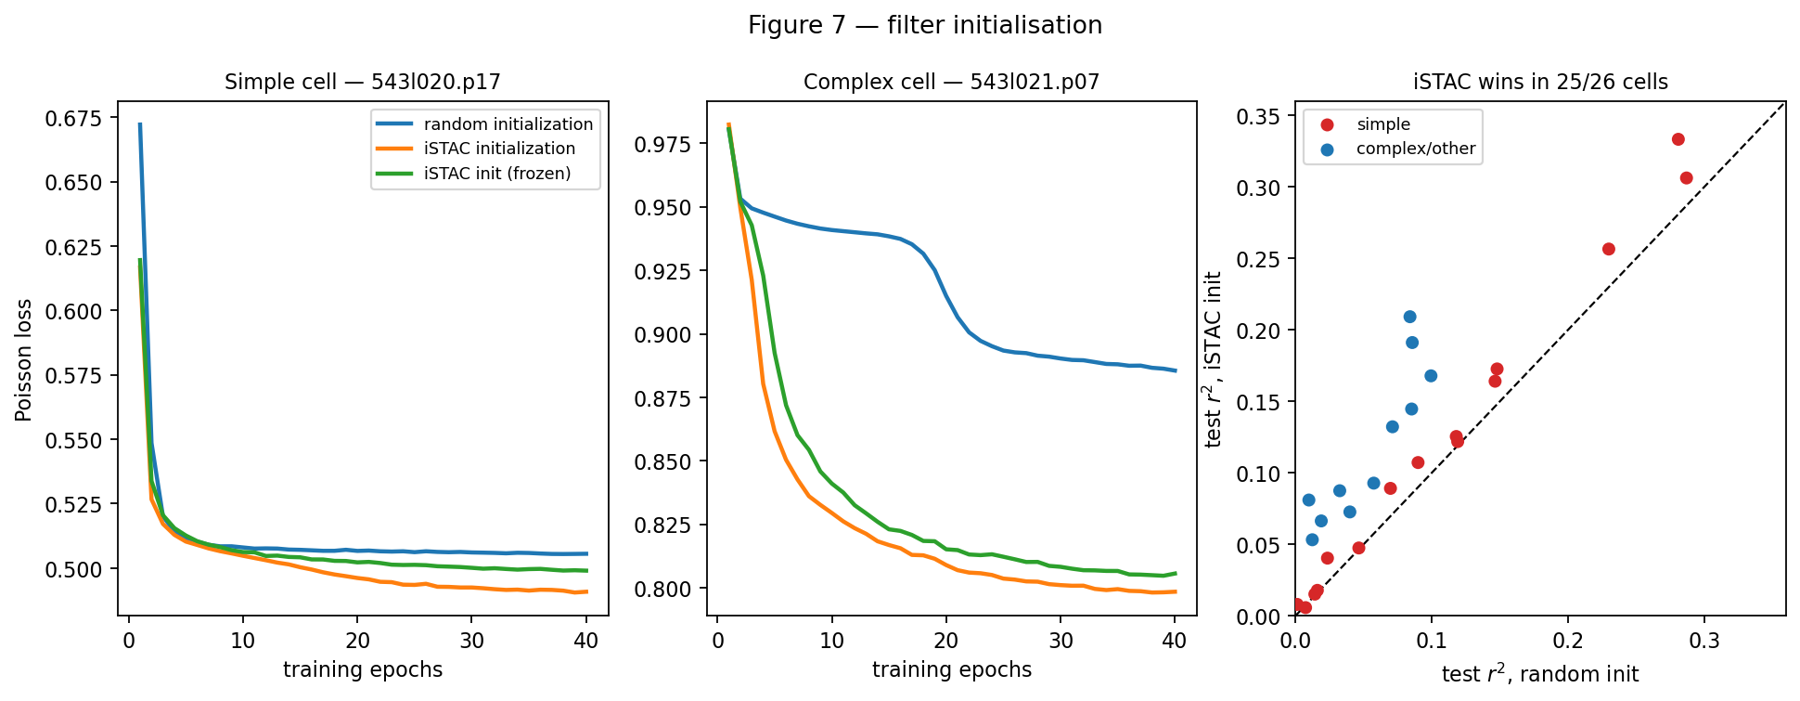
Starting a network from iSTAC filters trains to a lower loss and generalizes better than random initialization in 25 of 26 cells. Open full size Princeton Learning Lab, with Prof. Olga Troyanskaya, Summer 2024
Computer vision for ankle replacement surgery
I was selected from 340 applicants for a healthcare AI project in Princeton's Computer Science Department. I trained a YOLO detection model to find the tibia, fibula, and talus in ankle X-rays, then measured the joint angles surgeons use to plan ankle replacements directly from the detected bone contours. The project was a Regeneron Science Talent Search semifinalist (top 300) in 2025.
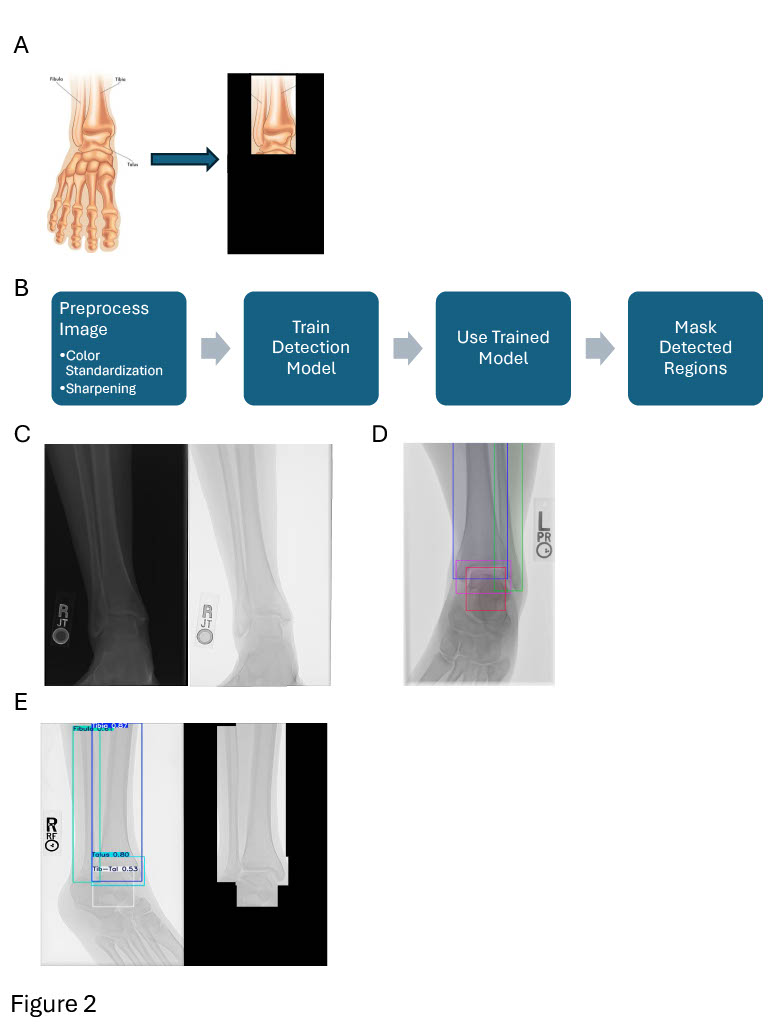
Detecting the ankle bones in X-rays. Open full size 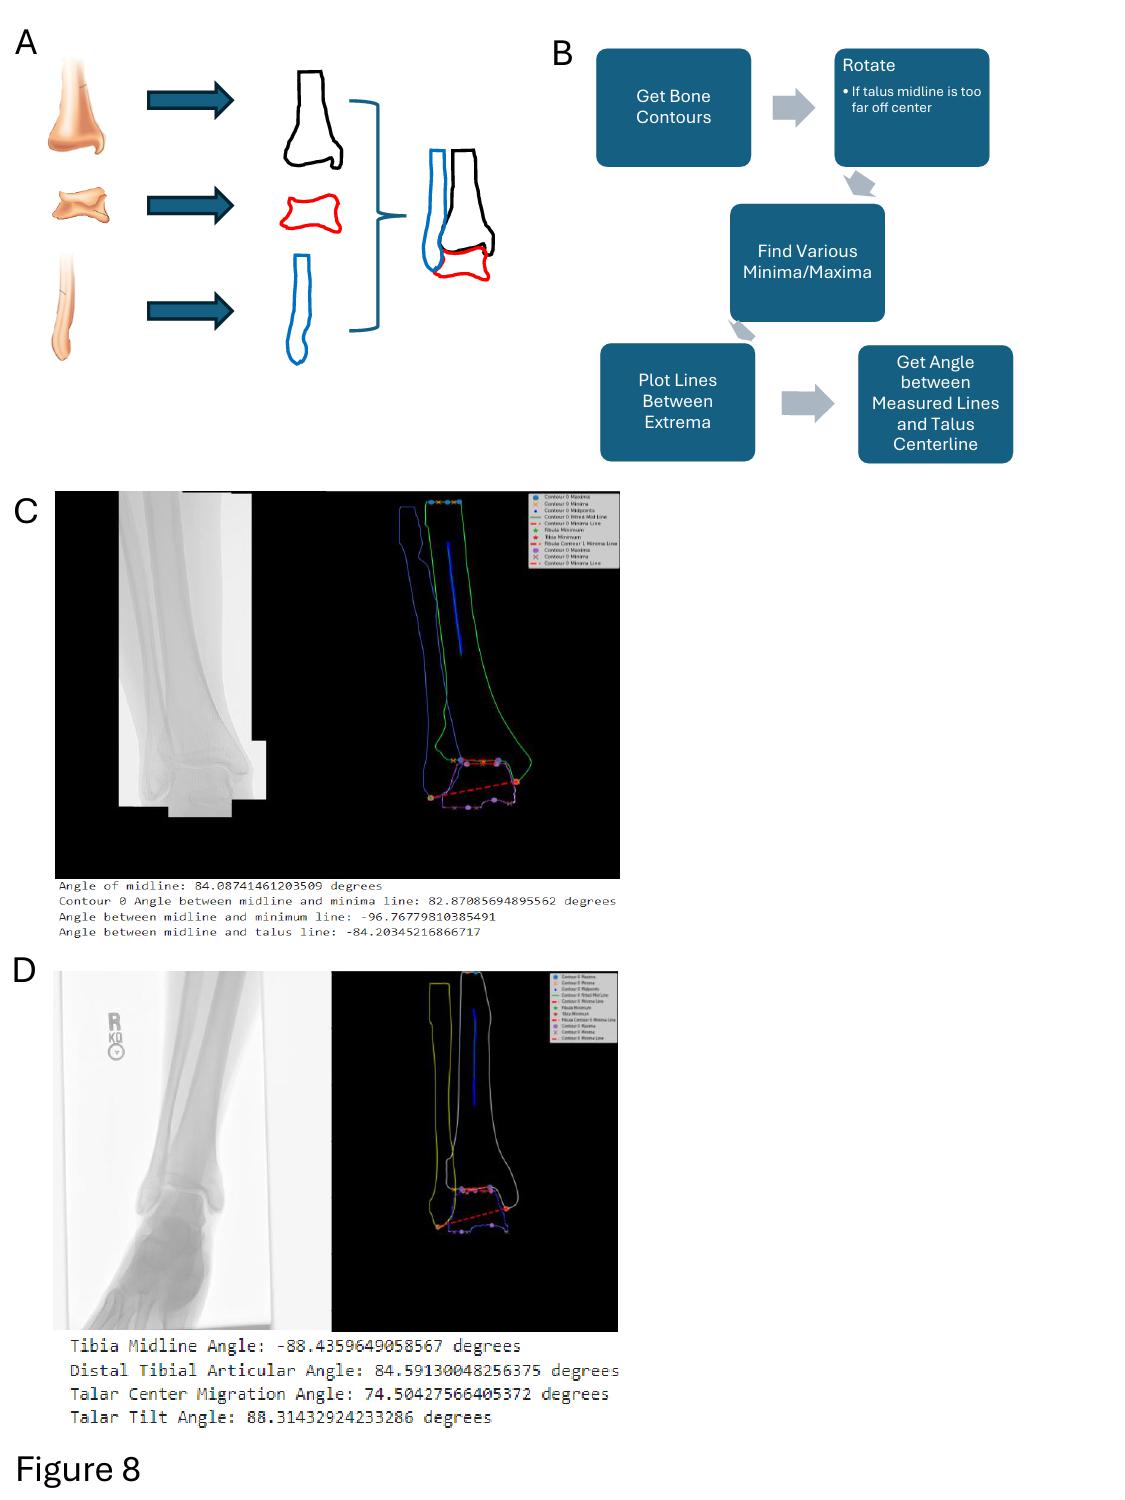
Measuring joint angles from the detected bone contours. Open full size With J. Sheehan, 2023
E. coli growth dynamics during phage infection
We tracked E. coli growth dynamics during Lambda(vir) phage infection, and the growth curves revealed that the phage decays over time. I presented this work orally at the 14th IEEE Integrated STEM Education Conference on March 9, 2024, the only high school student selected to do so. It won first place and the Air Force Research Laboratory Award at the 2024 Mercer Science and Engineering Fair.
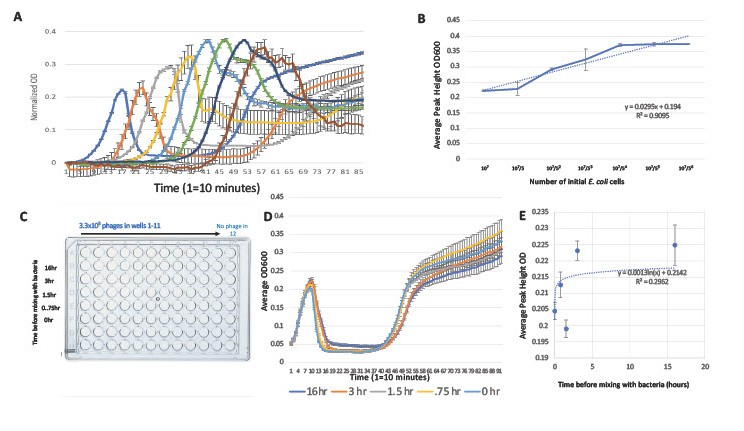
Growth curves under phage infection. Open full size